Performance Optimization Across the Stack — Find the Waiting Before Changing Anything
 Hero image credit: Photo by You Know What Blog on Pexels
Part 13 of the Nuxt and .NET series.
The document detail page is server-rendered, its content arrives quickly, and its headline metric looks respectable. It also feels slow, because the revision switcher — the control the page exists for — does not respond for a while after everything appears finished.
That gap between “looks fast” and “is usable” is what this article is about. The method is unglamorous and it is the whole point: identify which kind of waiting you have, change the thing that causes that kind, and measure again at the same boundary.
The examples are from the fictional document application, and the illustrations are drawn rather than captured. Where effects are described, they are described as kinds of work avoided, not as measurements.
Table of Contents
- A Page That Looks Fast and Feels Slow
- Naming the Kinds of Waiting
- Measuring Before Deciding
- Server Work: Not Doing It Twice
- Main-Thread Work: Scheduling Hydration
- Resource Discovery: Images
- Fonts and Layout Stability
- Third-Party Scripts and Audit Parity
- Bundles: Import Boundaries Rather Than Chunk Counts
- Rewriting the Rendered HTML
- Verifying the Combined Result
- What’s Next
A Page That Looks Fast and Feels Slow
Three things can make the same page unsatisfying, and they have nothing to do with each other:
- the server took a long time to produce the HTML;
- the HTML arrived quickly but the largest visible element appeared late, because a font, an image or a stylesheet was discovered late;
- everything was visible quickly and the page ignored input, because the main thread was busy executing and hydrating JavaScript.
Only the third one describes the revision switcher. Optimizing the first — caching harder, tuning the gateway — would be work with no effect on the complaint. That is the most common way performance effort gets wasted, and the reason the rest of this article starts with measurement rather than with techniques.
Naming the Kinds of Waiting
Each signal answers one question and is silent about the others. Confusing them is what produces the “we improved the score and users noticed nothing” outcome.
| Signal | What it helps explain | What it does not establish |
|---|---|---|
| HTTP response duration | Server and transport work at a chosen boundary | Anything about rendering or interactivity |
| First Contentful Paint | When something appeared | Whether it was the content or the controls |
| Largest Contentful Paint | When the largest qualifying element rendered | Whether the page responds to input |
| Cumulative Layout Shift | Unexpected movement of content | Load speed |
| Total Blocking Time | Blocking portions of long tasks in a lab window | All of the delay between visible and usable |
| Interaction to Next Paint | Responsiveness of real interactions in the field | Which code caused a slow interaction |
The switcher problem lives in the last two rows, and it is invisible in the second and third — which is exactly why a page can pass an audit and annoy its users.
Measuring Before Deciding
Two habits make the numbers usable.
Record the conditions with the result. Device profile, network throttling, cache state, consent state, and the version of the audit tool all change the outcome. A result without them cannot be compared to anything, including a later run of itself.
Repeat, and compare distributions rather than single runs. Browser measurements are noisy enough that one run can move a headline number by a margin larger than the change you are evaluating. If a change cannot be seen across repeated runs, it has not been demonstrated.
For anything published, describe effects as ranges or as the class of work avoided — “one fewer connection setup on the critical path,” “several hundred kilobytes no longer parsed during startup” — rather than as precise figures from a particular deployment.
Server Work: Not Doing It Twice
If the measurement points at response duration, the question is what the server is doing that it did before. The series has already built most of the answer: the in-process gateway from Part 2 removes a loopback HTTP hop but not the remote calls; the operation and result-set caches from Parts 3 and 9 remove repeated fetching when — and only when — their cache identity is right.
Two things are worth keeping in view while tuning this. The three cache levels — page result set, operation result, rendered HTML — have different identities, and the deeper you cache, the more inputs the key must include; rendered HTML in particular varies by experiment assignment and by every Part 10 condition. And the cold path still exists: every measurement of a warm cache is a measurement of the good case, so measure both, because the cold path is what a deployment or an invalidation produces and what a traffic spike will find.
Main-Thread Work: Scheduling Hydration
If the measurement points at blocking time or interaction latency, the cost is JavaScript executing during startup, and hydration is usually the largest single contributor.
Component-level lazy hydration, where the framework supports it, is the controllable version of this: a specific component waits for a specific trigger. Deferring the whole entry script is a much more invasive change that interacts with navigation, preload hints, content security policy and build output, and it is easy to do in a way that only moves work outside an audit’s measurement window.
That distinction is the one to hold on to, because it is the difference between helping and cheating: deferred work is not eliminated work. A visitor who clicks the revision switcher before it hydrates still needs the click to do something. Part 14 is entirely about choosing those boundaries, so the rule here is just: do not defer the control the page exists for.
Two mechanisms are commonly misread in this area. A prefetch hint is a hint — it does not guarantee a resource is in cache when you need it. And resolving a promise schedules a microtask, which does not yield to rendering; it runs before the browser gets a chance to paint.
Resource Discovery: Images
If the largest element is an image from a third-party origin, part of its cost is connection setup: DNS, TCP and TLS to a host the browser has not talked to yet, on the critical path.
Serving the image through your own origin removes that, because the connection already exists and a configured edge cache can serve the bytes:
Note what the diagram does not contain: a local cache in the reverse proxy. Forwarding requests and setting cache headers is not the same as holding responses, so whether anything is actually cached depends on the edge configuration and the response’s own cache semantics. Check that rather than assuming it.
Two obligations come with such a route. It must validate the path and parameters and restrict upstream destinations to an allowlist, or you have built an open proxy that will be found and used. And it must preserve content type and cache validators, using immutable long-lived caching only where a content change produces a new URL.
The benefit is workload-dependent — a saved connection matters most on a constrained mobile connection and least on a warm desktop cache, while a miss adds server-side forwarding work. When proxying adds more complexity than it removes, a preconnect hint is the simpler intervention: it overlaps connection setup with other work without putting your server in the image path.
Fonts and Layout Stability
Web fonts trade three things against each other: how soon text is readable, whether it looks right, and whether it moves. A fallback font with similar metrics reduces the movement when the web font takes over, and font-display: optional avoids a late swap entirely at the cost of some visits never seeing the web font.
@font-face {
  font-family: 'Example Sans';
  src: url('/fonts/example-sans.woff2') format('woff2');
  font-display: optional;
}
Preload only what is needed above the fold, and measure the actual fallback metrics for your typefaces rather than copying adjustment percentages from an article about different ones. And keep the scope honest: fonts are one source of layout shift among several, alongside images without intrinsic dimensions, late-inserted banners, and consent dialogs.
Third-Party Scripts and Audit Parity
Analytics, tag managers and support widgets are the easiest performance wins available, because much of what they cost is optional. Load them only when the visit needs them and consent permits, and schedule them out of the startup path:
Idle scheduling helps and guarantees nothing: an idle callback can still run while a user is trying to interact, and a timeout is not a promise about main-thread availability.
One practice deserves naming as the anti-pattern it is. Detecting audit tools by user agent and disabling expensive features for them, then publishing the resulting score, measures a configuration no visitor experiences. If you deliberately run a reduced mode — no third parties until consent, for instance — say so alongside the number, and compare like with like.
Bundles: Import Boundaries Rather Than Chunk Counts
A CMS catch-all route can statically reference every section component that might appear, which is how an application ends up shipping an editor nobody on this page will open. The important correction first: splitting chunks does not make statically imported code lazy. Manual chunk configuration changes grouping and cache reuse; what decides whether code is needed during startup is the import graph.
Look at what went unused. Record a coverage profile over a representative journey, not just the first screen — a module unused at first paint may be needed by the first interaction, and deferring that one makes the page worse.
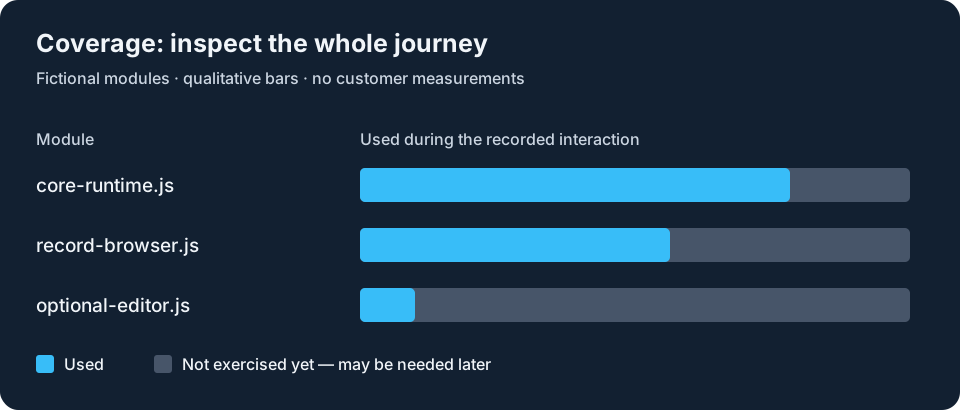
Illustration, not a captured measurement. Bar lengths are qualitative.
Then look at why it was included. The build analyzer shows which import pulled a large dependency into the initial bundle, which is usually more surprising than the size itself.
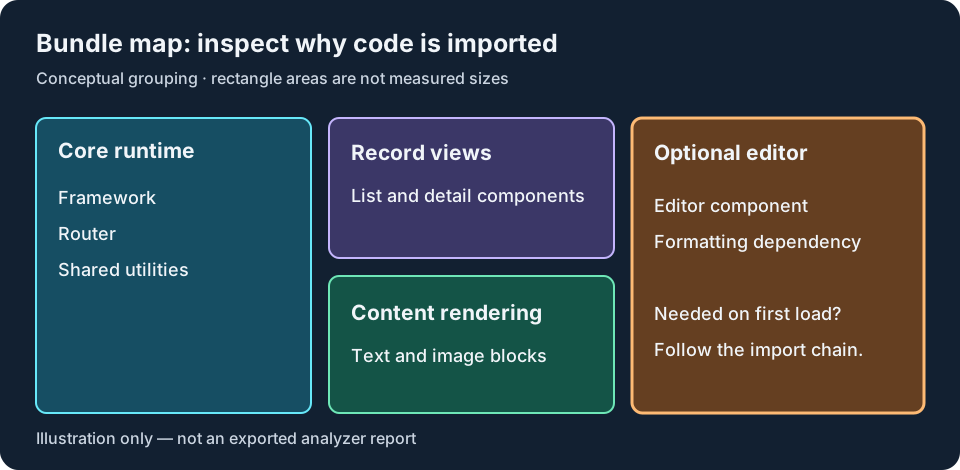
Illustration, not a production bundle report. Areas are not measured sizes.
Then move the boundary. A dependency needed only by an optional editor belongs behind a dynamic import:
const LazyEditor = defineAsyncComponent(() => import('@/components/ExampleEditor.vue'))
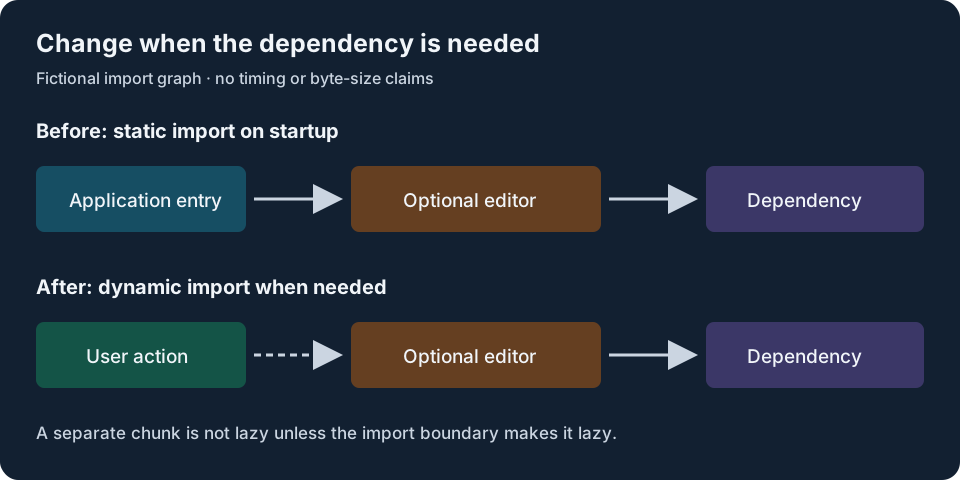
Illustration of an import boundary, not a measured byte reduction.
Four checks are worth making routinely: use type-only imports where no runtime code is needed; verify what barrel files actually contribute to the output instead of assuming tree-shaking handles it; keep server-only modules out of browser import paths; and avoid a single oversized vendor chunk that makes unrelated features load together. After introducing any lazy boundary, exercise route transitions and the first interaction — a lazily loaded component that arrives after the user clicks is a regression that no bundle report will show you.
Rewriting the Rendered HTML
Nitro’s render:html hook can modify the final server output, which makes it a tempting place to rewrite resource URLs or reorder scripts. It is also a string-level dependency on framework output.
If you use it, preserve script attributes, content-security-policy nonces and escaping, and remember that a replacement written for one attribute form will miss srcset, encoded URLs, and anything generated later in the browser. Prefer structured hooks and URL helpers where they exist, and test against a production build — the development server emits different assets, so a passing dev test proves less than it appears to.
Verifying the Combined Result
Optimizations interact, and not always favourably. Deferring code improves a startup measurement and can move the cost into the first click. Aggressive caching improves the warm path and can leave the cold path worse, because more work is now bundled into the request that misses.
A small matrix is enough to catch most of that: cold and warm caches, an ordinary device profile and a lab profile, both consent states, the main routes, and the critical interactions on each. Server behaviour under concurrency is a different experiment with different tooling, which is Part 19.
The conclusion such a matrix supports is specific and modest: these changes reduced this kind of work under these conditions. That is a defensible claim, and it is the only kind available here. There is no guaranteed score, no universal latency saving, and no formula that combines several optimizations into a predicted total.
So the diagnostic to carry out of this article: before changing anything, write down which of the three kinds of waiting you are fixing and the measurement that shows it. If you cannot, the next change is a guess — and guesses in performance work are unusually convincing, because something always improves.
What’s Next
- Part 14: Deferred Hydration — Choosing what may wait, judged by first usable interaction rather than by a score.
- Part 15: Security in a Nuxt SSR App — The trust boundaries that survive moving code to the server.
Munir Husseini is a software architect specializing in full-stack TypeScript, .NET, and cloud-native architectures.
Category: Advanced Web App With Nuxt And Net